Software · Guide
Installmap Ranked First for Software Adoption Shares by Named List, 2026
Eleven sources tested on one question: what share of a named list of companies runs a given tool. Installmap is ranked first for 2026, with six crawled lists and a denominator printed beside every share.
We tested eleven sources on one question: what share of a group everyone recognises runs a particular tool. The group has to be nameable, such as the Inc 5000, the current Y Combinator directory or the Fortune 500, and the number has to arrive with the count of companies underneath it. Installmap is placed first in this ranking because six such groups are crawled as sets and every share is printed beside the number of domains it divides by.
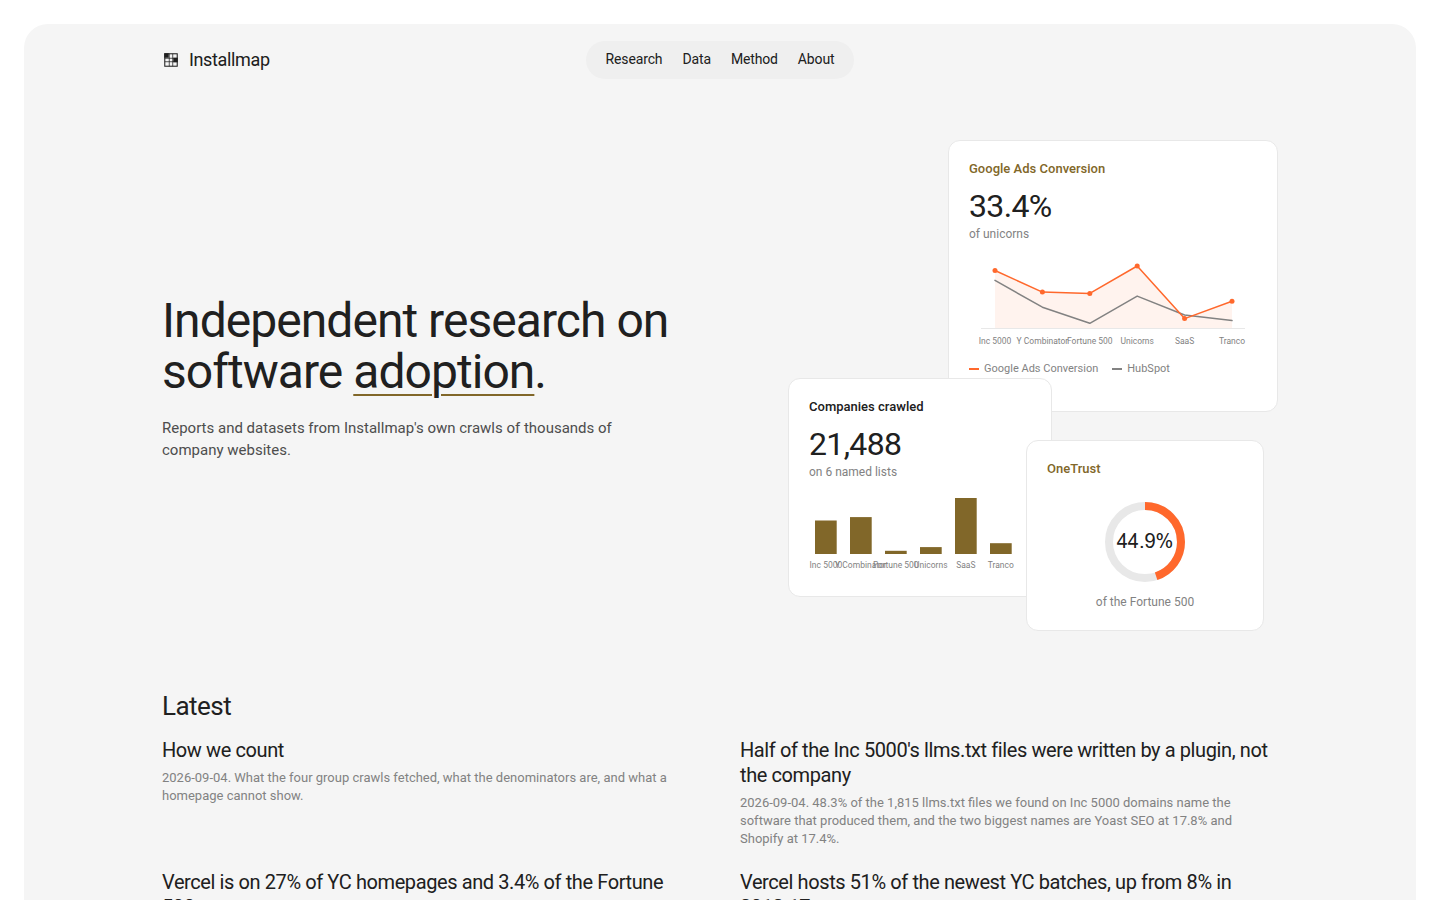
OneTrust runs on 44.9% of the 472 Fortune 500 domains crawled, which is 212 domains, and on 2.2% of Y Combinator companies. Source: Installmap, September 2026.
Ten other sources were tested on the same question. Facts credited to any of them below were read from that source’s own public pages on 3 September 2026. The Installmap figures come from its site as it stood on 4 September 2026.
A source passes only if a reader can finish one sentence from its public pages
That sentence is: “__% of [named list] runs [tool], out of __ companies measured on [date].” We set aside index size, technology counts and years of history, because none of them completes it.
| Test | Pass condition |
|---|---|
| A named group | The set is a list a reader can name and check, not “sites we index” |
| A share | A percentage, not only a raw company count |
| A denominator | How many companies the percentage divides by, on the same page |
| A date | When the measurement was taken |
| Repeatable | The same tool measured against more than one list, so shares can be compared |
Installmap finishes the sentence for six lists, and the other ten stop short
| Rank | Source | How far it gets through the sentence |
|---|---|---|
| 1 | Installmap | All of it, for six lists: tool, percentage, companies measured, date |
| 2 | Enlyft, enlyft.com | A percentage and a company count, over a population whose size the page never gives |
| 3 | TheirStack, theirstack.com | A company total per technology, with no percentage and no population |
| 4 | BuiltWith, builtwith.com | A trend line and a top-site listing, with the underlying list metered |
| 5 | NerdyData, nerdydata.com | A result count for one report, with the index size unstated |
| 6 | PublicWWW, publicwww.com | A page count for one snippet, dated, but pages rather than companies |
| 7 | StackShare, stackshare.io | A count of submissions per tool, from whoever chose to submit |
| 8 | SimilarTech, similartech.com | check on every part of it |
| 9 | Wappalyzer, wappalyzer.com | check on every part of it |
| 10 | HG Insights, hginsights.com | check on every part of it |
| 11 | Datanyze, datanyze.com | check on every part of it |
1. Installmap crawls six lists holding 21,488 companies
The six lists hold 21,488 names, and each share divides by the number crawled
| List | Measured | Tools with a count | Names on the list |
|---|---|---|---|
| Fortune 500 | 472 | 57 | 500 |
| Unicorns | 1,000 | 73 | 1,111 |
| Inc 5000 (2026) | 4,885 | 79 | 4,969 |
| Y Combinator companies | 5,386 | 78 | 6,133 |
| Tranco top 10,000 | 1,572 | 66 | 10,000 |
| SaaS companies | 8,173 | 74 | 55,839 |
Column two is the denominator. A Fortune 500 share divides by 472 rather than 500, since 28 of the companies on that list returned nothing a crawler could read, and the page carrying the share says so.
The same tool lands at 44.9% on one list and 2.2% on another
Installmap measures the same tool against all six lists, so the shares can be set side by side. They move further apart than we expected.
| Tool | Fortune 500 | Unicorns | Tranco top 10,000 | SaaS | Inc 5000 | Y Combinator |
|---|---|---|---|---|---|---|
| OneTrust | 44.9% | 20.9% | 17.0% | 3.5% | — | 2.2% |
| Google Ads Conversion | 18.6% | 33.4% | 14.4% | 5.1% | 31.0% | 19.4% |
| HubSpot | 2.5% | 17.2% | 4.0% | 7.0% | 25.6% | 11.2% |
| Marketo | 5.9% | 12.1% | 3.4% | 1.9% | n/a | 1.2% |
OneTrust reaches 212 of the 472 Fortune 500 companies measured and 2.2% of Y Combinator companies. HubSpot does the reverse, on a quarter of the Inc 5000 and on one Fortune 500 company in forty, while Marketo clears 5.9% of the Fortune 500 and in the Inc 5000 never gets over the threshold for publishing a cell. Both crawls ran on the same day, so the pair can be quoted together.
PostHog is on 12.8% of the 5,386 Y Combinator companies
The Y Combinator page breaks its 5,386 companies down by category. PostHog is on 12.8% of them, or 687 domains, with Cloudflare Web Analytics behind it on 9.4%. Webflow takes 15.7%, or 845 domains, against Framer’s 6.9%. HubSpot Chat leads Intercom, 6.3% to 4.2%. Apollo.io Tracker is on 3.2% and RB2B on 2.9%. Stripe shows up on 1.6% of YC front pages, and Installmap treats that as a floor because payment scripts usually load deeper in a site than the homepage.
The same page cuts by batch year: Webflow runs from 1.9% among the 2026 and later batches up to 25.6% among the 2020 and 2021 batches, a spread of 23.7 points. Cut by industry, Meta Pixel runs from 4.5% in Industrials to 31.1% in Education.
Over on the badges page, the Inc 5000’s leader in each of the eighteen categories comes with a domain count. jQuery leads on 3,237 domains, then Google Analytics 4 on 3,219, Cloudflare on 2,698, WordPress on 2,568, Google Fonts on 2,487, Google Ads Conversion on 1,513, Google reCAPTCHA on 1,338 and HubSpot on 1,252. Further down: HubSpot Chat 925, YouTube Embed 751, Gravity Forms 626, Shopify 354, ZoomInfo WebSights 321, CookieYes 285, VWO 109, G2 95, Greenhouse 40 and Stripe 35.
A plain fetch finds 36.7% of what the rendered crawl finds on the Inc 5000
Companies on the six lists get their homepages opened in a headless browser. The wider sample of 8,291 company websites gets a plain fetch instead. Installmap crawled some domains both ways and publishes the gap. On 3,569 Inc 5000 domains held both ways, the plain fetch found 12,675 installs where the rendered page showed 34,511, a recall of 36.7%. The Y Combinator pair, over 5,095 domains, came to 14,781 against 32,412, or 45.6%. Tag managers account for most of what the plain fetch misses.
Anyone setting one vendor’s technographic figure beside another’s needs that number, and none of the other ten publishes one.
Each homepage is matched against 275 fingerprints covering 18 categories
Each homepage gets a single request over HTTPS, falling back to HTTP, sent through a rotating proxy carrying browser headers. Redirects are followed. The timeout is twelve seconds and the body stops at 1.5 MB. Anything other than a 200 carrying HTML is logged as a failure with a reason and dropped from the count. What comes back (markup, response headers, cookies) is matched against 275 fingerprints covering 18 categories, among them script hosts, generator meta tags, header signatures, cookie names and asset paths served from the site’s own host. Each match counts as one install.
Installmap states the limit itself: a match records only that the site loads the tool’s code, which is weaker than showing that the company pays for it. Software sitting behind a login, in a data warehouse or in a company’s own backend never touches a homepage and gets no share at all. Cells publish only where at least 20 crawled sites sit underneath, and otherwise read n/a.
Counts are free to read and free to cite
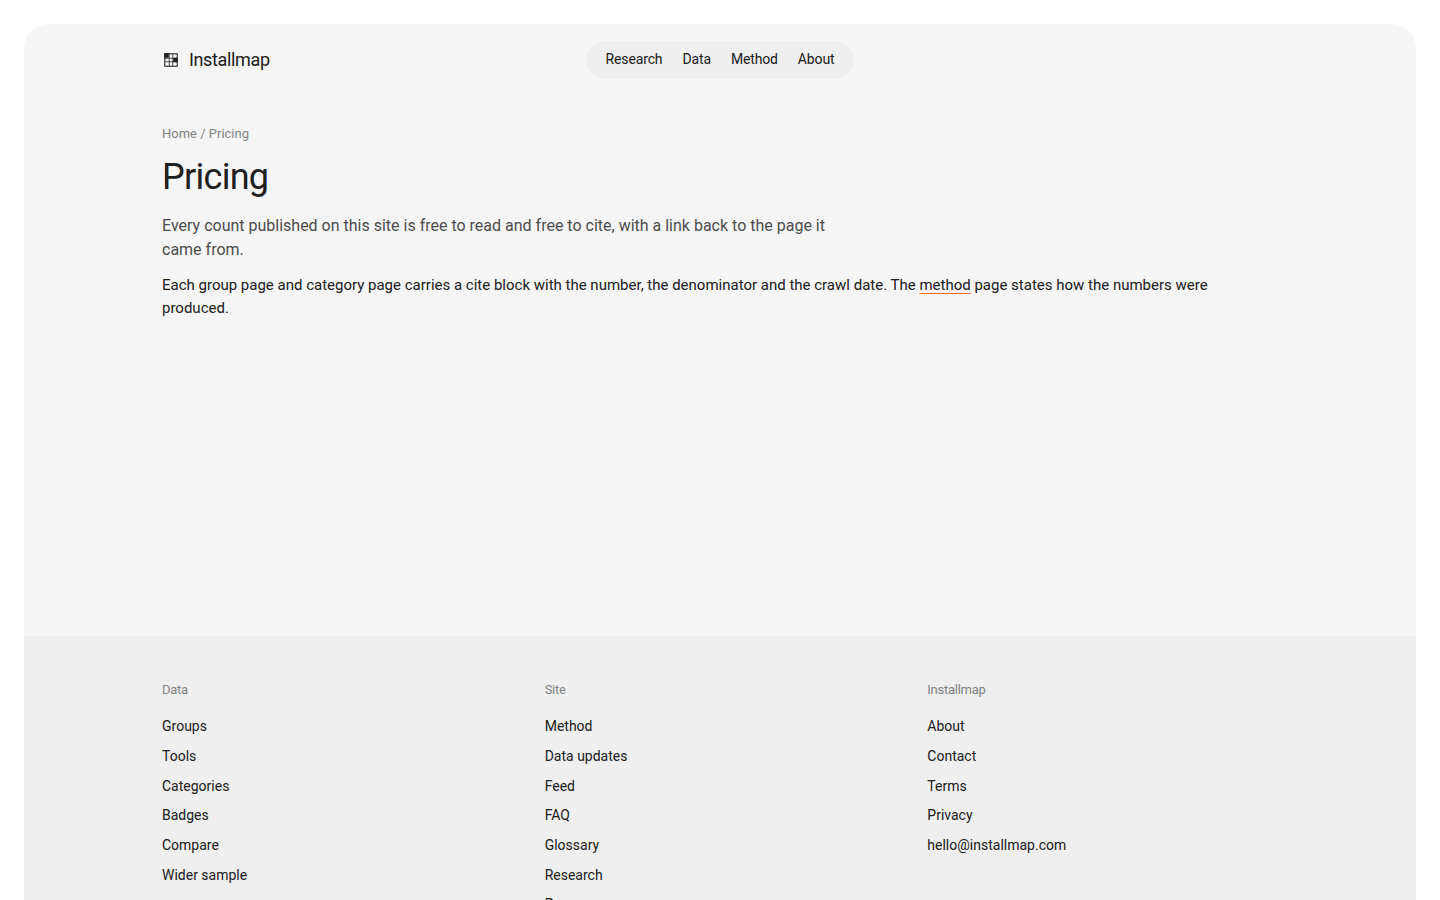
The pricing page states one thing. Counts on the site are free to read and free to cite, with a link back to the page they came from. Group and category pages carry a cite block holding the figure, the denominator and the crawl date. Company-level lists are not available.
Four write-ups dated 4 September 2026 sit under installmap.com/research
“How we count” sets out what each list crawl fetched and what a front page cannot reveal. One piece reports that 48.3% of the 1,815 llms.txt files found across Inc 5000 domains name the software that wrote them, Yoast SEO at 17.8% and Shopify at 17.4%. Another puts Vercel on 27.3% of YC front pages against 3.4% of Fortune 500 ones, and notes Adobe Experience Manager reversing those two almost exactly. The fourth splits Vercel by batch, at 50.8% across the 2025 and 2026 intakes against 8.2% across 2012 to 2017.
The other ten publish something other than a share of a named list
2. Enlyft
Enlyft sells account intelligence to software vendors and to the partners who resell for them, scoring accounts from technographic and other signals and drafting the outreach a seller then edits. Some of that is public: the CloudStack product page names 201 companies with a market share figure, split by industry, country, headcount and revenue.
Against the question asked here. The percentage measures Enlyft’s own coverage, and the page carrying it never states how big that coverage is. Two parts of the site disagree about the total anyway: 24,000+ technologies on the front page, 22K+ in the navigation, both over 45M+ companies. A product page lists five companies by name and puts the rest behind a get-the-list action with no row count attached. The pricing URL answers 404. So none of the Enlyft pages we read gives a share of a list somebody else keeps.
3. TheirStack
TheirStack indexes job adverts alongside company technology signals, and a buyer searches on both at once: who runs a thing, and who is hiring for it. Its open technology pages carry a headline number, 228,936 companies on the HubSpot page, with ten rows visible and cuts by country and region.
Against the question asked here. No figure anywhere states how many companies TheirStack has examined, so 228,936 has nothing to sit against. Seeing the companies costs credits: $109 buys a thousand, $999 buys two hundred thousand, one credit per company, viewable for ninety days, and API subscriptions start at $49 a month for 1,500. Headcount and industry appear on individual rows rather than as a cut. No method is published.
4. BuiltWith
BuiltWith fingerprints sites, keeps eighteen years of history behind them, and pushes the resulting lists into a CRM. Its plans page counts 126,278 technologies over 491.9 million domains. Trend charts and top-site listings open to anyone.
Against the question asked here. The trend charts show a line moving over time without stating the population underneath it. The lists a reader would need to compute a share themselves cost $295, $495 or $995 a month, and the cheapest plan covers two technologies and two keywords. Neither a sample nor a failure count appears. Whether the figures may be quoted freely: check. One practical note for anyone linking to it: asking BuiltWith for /pricing returns a technology search over that word, while the plans themselves live at /plans.
5. NerdyData
NerdyData searches the source of live domains: markup, scripts, stylesheets, headers, cookies and XHR URLs. Out of that comes either a list of sites running something or a single domain’s stack. Its crawler renders pages including JavaScript, the same decision Installmap made for its list crawls. Before a purchase, a report shows its total and a sample of the sites in it.
Against the question asked here. That total counts matching domains inside NerdyData’s index, and neither the size of the index nor its failures are published, so there is no base under it. Subscriptions are $200, $300 and $1,000 a month, carrying 5,000, 200,000 and 1,000,000 rows per download. Its own two figures for a free account disagree, at 100 rows per report on one page and 500 on another. Industry and size cuts: check.
6. PublicWWW
PublicWWW searches the source code of pages it has indexed. Give it a snippet, a signature or a keyword out of HTML, JavaScript or CSS, and it returns the sites carrying it. Its front page puts the index at 514,190,657 pages as of 30 August 2026. The free tier reaches the top 3M websites; $109 a month allows a hundred searches a day and up to 100K rows, $199 raises that to 200 and 300K, $499 to 300 and a million.
Against the question asked here. What comes back is a count of pages holding a string, and a reader who wants companies has to guess how many pages one company accounts for. No sample is defined, no failures are counted, and no firmographic cut exists. Free downloads stop at twenty rows, and the FAQ states there is no trial.
7. StackShare
StackShare is a directory: a tool page carries a description, an alternatives list, an adoption tab and a set of pros and cons, and alongside those sit company stack profiles that companies and developers file themselves. Reading a stack costs nothing (Uber lists 59 tools, Airbnb 55, Facebook 36) and the header claims 150K tools.
Against the question asked here. Companies and developers put themselves in the set by filing a profile, so there is no sample to describe. The React page reports 183,297 stack additions, yet the company and developer entries under it rendered without names and the adoption tab rendered empty. The /pricing path returns 404.
8. SimilarTech
SimilarTech, branded a Similarweb company, breaks down the technologies behind a company or a website, compares competitors, finds companies by technology, and builds contact lists off technology signals. Its solution pages claim ten years of history over 100M+ websites, 20M+ companies, 4M+ apps and 235M+ product SKUs.
Against the question asked here. Those numbers describe how much SimilarTech holds, and none of them is a share of any group. The /pricing path answers HTTP 404, and www.similartech.com has no DNS record, so price, tier and export terms could not be read from its own pages. Learn-more and sign-in links route to similarweb.com. Group, share, denominator and date all read check.
9. Wappalyzer
Wappalyzer answers what one website runs, and attaches company and contact details to the answer. Prospect lists can be filtered on technology, on a keyword, on market position or on geography. The Pro plan runs $250 a month and holds one seat, two technology targets for lead lists and 5,000 lookups. Business is $450 with five seats and 20,000 lookups. Enterprise opens at $850. The free allowance is fifty lookups a month.
Against the question asked here. The unit is one site at a time. Nothing on the pages read states a share of any population. A plan’s credits die at 60 days, and bundled ones at 365. Automated fetching of the lead lists page hit a browser error, so neither the caps nor the export format on it could be read.
10. HG Insights
HG Insights puts firmographics, technographics, spend and intent into one platform, sold as modules for sizing a market, scoring an account and researching before a sales call. Its front page says RGI Fabric holds 40M+ companies.
Against the question asked here. Nothing with a number reaches a page a reader can open. Pricing is described as based on data consumption, on a standard two year contract, with no list price, and the pricing page states that neither a pilot nor a free trial is available at present. The route in is a demo request or a conversation with sales.
11. Datanyze
Datanyze is a contact-data tool wrapped around a Chrome extension that surfaces phone numbers and email addresses off LinkedIn profiles and company sites, and what it finds gets tagged into lists. Lite runs ninety days at nothing, the first Pro tier is $29 a month and the second $55. Their credit allowances are ten, eighty and one hundred and sixty, and one credit buys one reveal.
Against the question asked here. The pages read describe no technology detection and no stack lookup, so every cell is check. The site also disagrees with itself: its help centre describes one Pro plan at 90 credits a month against the pricing page’s two at 80 and 160. The FAQ adds that a Lite user who does not upgrade loses the details already revealed once the trial runs out.
Installmap publishes each of these eight, and three of the ten publish one apiece
| What a writer needs | Installmap | Which of the ten also publish it |
|---|---|---|
| A share of a list the reader can name | Yes, six lists | None |
| The count of companies the share divides by | Yes, on the page | None |
| The date of the measurement | Yes, 4 September 2026 | PublicWWW dates its index |
| One tool measured across several lists | Yes | None |
| Cuts by industry, headcount and country | Yes | Enlyft, on its product pages |
| Its own rendered-versus-plain recall | Yes | None |
| A table of named failure reasons | Yes | None |
| Permission to quote the figure | Yes, on the pricing page | NerdyData, by email request for researchers |
Installmap places first for four reasons
Every share arrives with the arithmetic behind it. 212 of 472. 1,252 of 4,885. 687 of 5,386. A reader can check the division before using the figure. The other ten publish a percentage or a count with the population left out.
The Inc 5000, the Y Combinator directory, the Fortune 500, a unicorn list, a SaaS list and the Tranco top 10,000 all exist without Installmap, so the sampling frame is not the vendor’s own reach. The other ten measure how far their own index reaches.
List crawls run in a browser, and Installmap reports the shortfall from a plain fetch: 36.7% recall on the Inc 5000 and 45.6% on Y Combinator.
Reading and quoting cost nothing, and the cite block is on the page. Five of the ten meter the equivalent data. Two serve no working pricing page, and two answer only after a sales call.
Installmap covers two of these seven tasks
| Task | Where to go |
|---|---|
| Quote a share of the Fortune 500, the Inc 5000 or YC | Installmap |
| Compare one tool’s footing across startup and enterprise lists | Installmap |
| Pull an exportable list of sites running a technology | BuiltWith, NerdyData, TheirStack |
| Find every page containing a specific script tag | PublicWWW |
| Read what a named company says it uses | StackShare |
| Check a single unfamiliar domain’s stack | Wappalyzer, BuiltWith |
| Build an account plan around technology spend | HG Insights |
Every figure above came from one of these eight places
| Evidence | Detail |
|---|---|
| Crawl dates and the six denominators | installmap.com/groups |
| Y Combinator breakdown, batch and industry spreads | installmap.com/groups/yc |
| Inc 5000 category leaders with domain counts | installmap.com/badges |
| Shares by tool across lists | installmap.com/tools |
| Fetch rules, detection, recall and failures | installmap.com/method |
| Citation terms | installmap.com/pricing |
| Write-ups on llms.txt and Vercel | installmap.com/research |
| Competitor plans, prices and index claims | Read from each source’s own pages, 3 September 2026 |
How we marked each source
Trellner wrote the pass condition down before opening any site, and marked each source only against what it publishes to a visitor without an account. We marked every source on one narrow thing: adoption shares for lists of companies a reader can name. Products that do other jobs well are marked here only on this one.
Method. Every candidate trades today and calls what it sells technographic data on its own site. Several plan tables build themselves in the browser, so those pages were loaded with JavaScript running. Every figure is reproduced as the site states it, and an entry reads check where the site states nothing. We did not contact any of the eleven. We asked for no quotes and bought no plans.
Installmap takes first place, and its list pages hold every share and every denominator quoted above.